


Visual Paradigm’s AI Infographic Generator is a powerful tool for turning complex topics into clear, visual stories. This article shows a real-time workflow for creating an infographic on the solar energy process. The process is fast and requires no design skills. You can generate a professional-looking visual in minutes. The tool uses AI to analyze your topic and create structured content. It then renders this content into a polished infographic using a pre-designed template. This is an ideal solution for marketers, educators, and business professionals who need to communicate information effectively.
Quick summary
-
Use the AI Infographic Generator to create visuals from text.
-
Start by selecting a template from the gallery.
-
Enter your topic and the number of items.
-
Click “Generate Content” to let the AI create the data.
-
Review the generated infographic and make final adjustments.
-
Export as SVG for high-quality use.
Starting with a Template
Every infographic begins with a template. The first step is to choose a design that fits your topic. The AI Infographic Generator offers a gallery of professionally designed templates. You can browse categories like “Steps & Progression,” “Lists & Grids,” and “Data Visualization.” For a topic like the solar energy process, a step-by-step progression template is ideal. This template provides a clear structure for presenting a sequence of events.
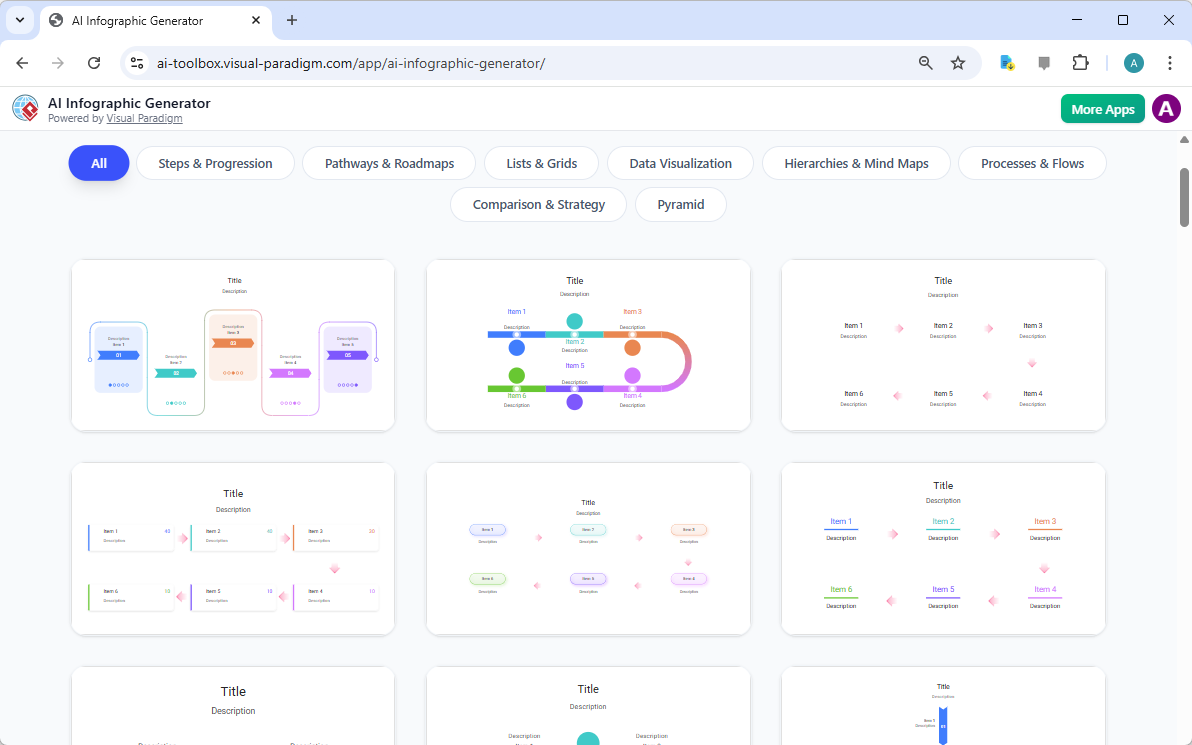
shows the template gallery. You can see various styles, from simple lists to more complex flowcharts. Selecting the right template ensures your final infographic has a professional and consistent look from the start.
Entering Your Topic
After selecting a template, you move to the editor. The left side of the screen is the input pane. Here, you provide the core information for your infographic. The first field is “What is this infographic about?” You type a clear description of your topic. For this example, the prompt is “Steps in the Solar Energy Process.” This text guides the AI to generate relevant content. The AI will research the topic and create a list of key points. The quality of your prompt affects the quality of the output. A specific prompt like “The 5 key stages of solar energy conversion” will yield better results than a generic one.
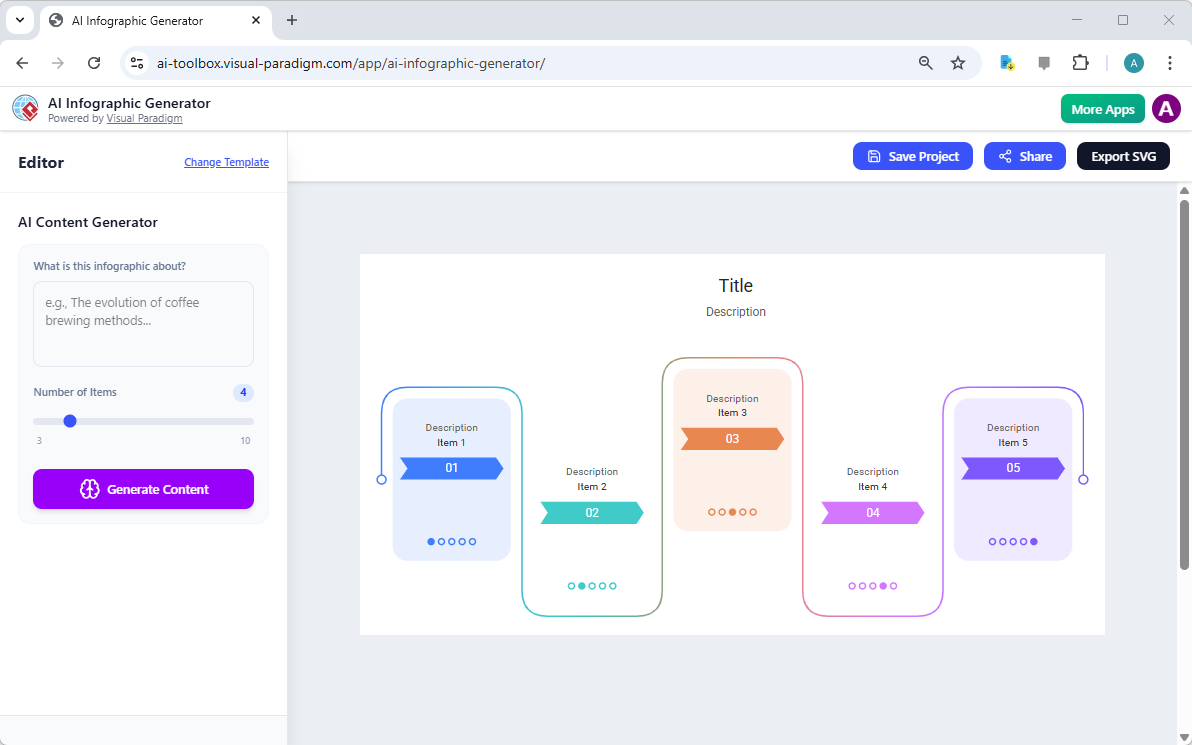
shows the editor with the input pane on the left and the preview on the right. The template is already loaded, ready to be populated.
Generating the Content
Next, you define the scope of your infographic. The “Number of Items” slider lets you control how many points the AI will generate. For the solar energy process, a range of 5 to 6 items is appropriate. You can adjust the slider to set the desired number. Once you have the right number, click the “Generate Content” button. The AI analyzes your prompt and the number of items. It then creates a structured list of data points. This includes a title, a description, and individual items with text and dates.
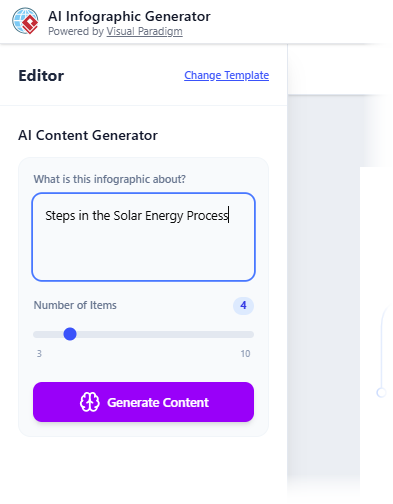
shows the prompt entered, and
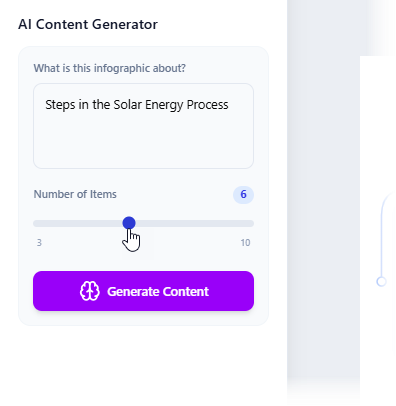
shows the slider set to 6 items. The AI will now process this request and populate the infographic with the generated content.
Reviewing the Initial Output
After clicking “Generate Content,” the AI renders the infographic. The right side of the screen displays the full visual. The AI places the generated data into the template’s layout. The result is a complete, structured infographic. However, the initial version may have issues. For example, text might overlap or be too large for its space.
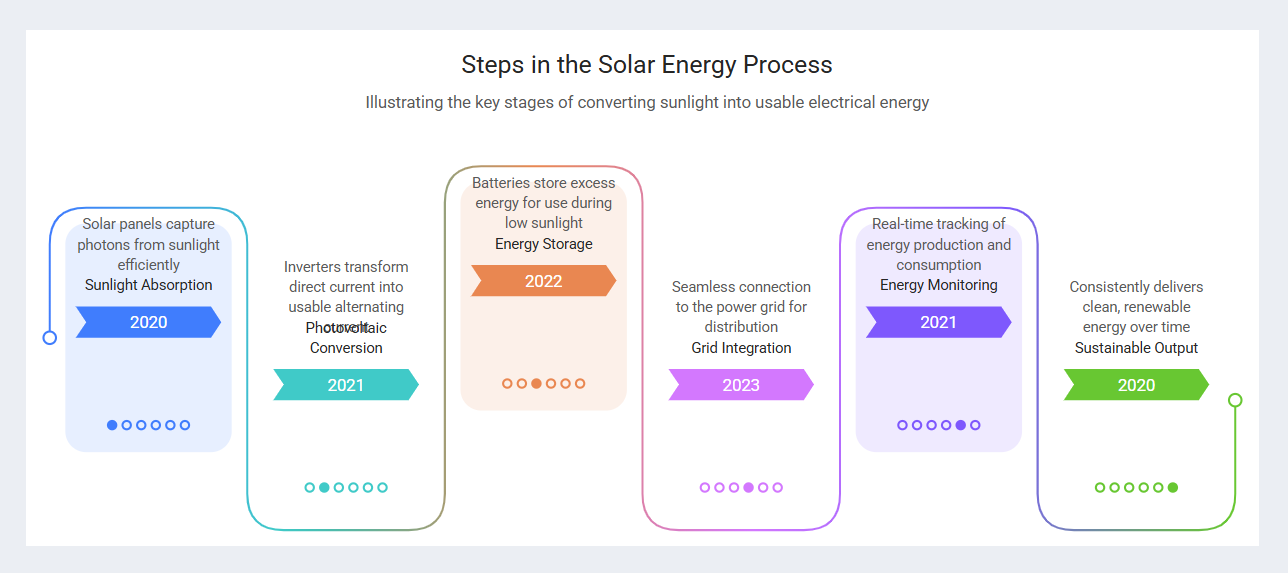
shows the generated infographic for the solar energy process. The text is dense, and some labels are not perfectly aligned. This is normal. The AI focuses on content creation, not perfect layout. The next step is to refine the visual elements.
Final Touches and Export
The AI-generated version is a starting point. You can make adjustments to improve readability and visual appeal. The editor allows you to resize text labels, move them, and change their color. You can also edit the text directly. For instance, you might shorten a long description or change a word. These changes are applied to the visual in real-time. However, the editor does not save these edits. They are only visible in the preview. To preserve your changes, you must export the final version. The tool provides a “Share” button and an “Export SVG” button. Exporting as SVG creates a high-quality, scalable file. This file will contain all your final edits.

shows the text editing options. You can change the font size and color.
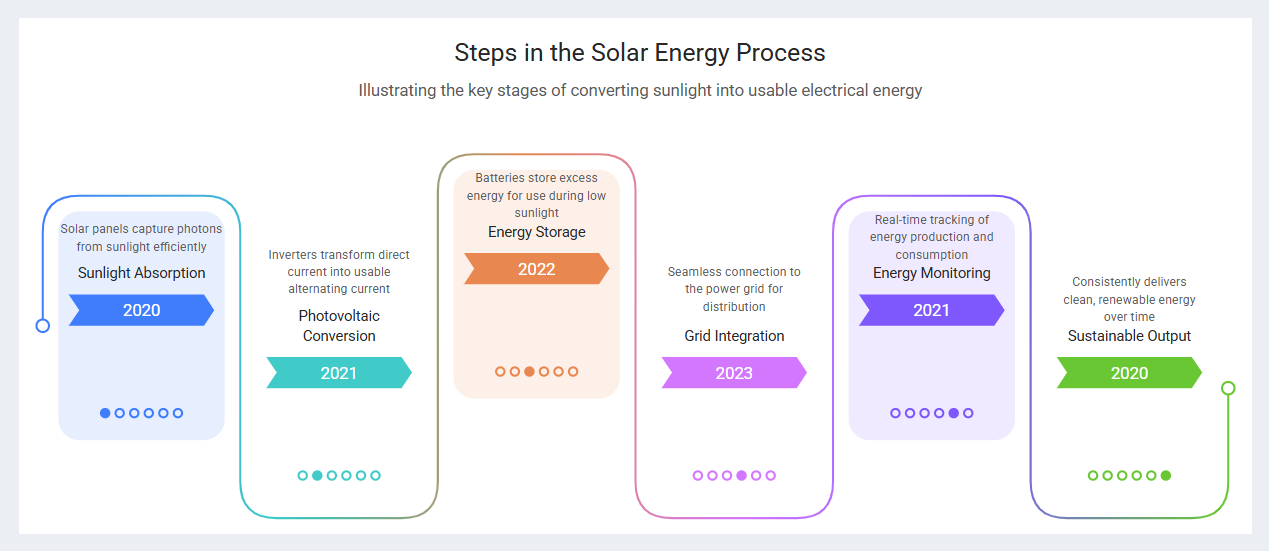
shows the final, polished infographic after all adjustments have been made. The text is clear, the layout is balanced, and the visual is ready for use.
Conclusion
Creating an informative and visually appealing infographic is now faster and easier than ever. The AI Infographic Generator by Visual Paradigm automates the most time-consuming parts of the process. You provide a topic, and the AI generates the content and data. The tool then renders this into a professional template. This allows you to focus on your message, not on design. The entire workflow, from idea to final export, takes just minutes. Whether you need to explain a complex process, present data, or create engaging content for social media, this AI-powered tool is a powerful solution. Try it now to see how quickly you can turn your ideas into compelling visuals.
Ready to create your own infographic? Try the AI Infographic Generator now.
Related Links
Infographic makers provide intuitive, often AI-powered platforms for transforming complex data into visually compelling narratives through drag-and-drop tools, professional templates, and automated design suggestions. These solutions enable teams to enhance visual communication and storytelling without requiring extensive design expertise.
-
Free Infographic Maker – Create Professional Infographics Online: This web-based tool allows users to design informative and visually appealing infographics without any prior design experience.
-
InfoArt – All-in-One Infographic Design Platform: A comprehensive solution for creating, sharing, and publishing professional infographics using intuitive drag-and-drop functionality.
-
Step-by-Step Guide to Creating Infographics with Visual Paradigm Online: A detailed guide that walks users through the process of designing effective visuals using a user-friendly interface.
-
AI-Powered Visual Tools for Creating Infographics, Charts, and Graphics: This article explores how artificial intelligence accelerates the design process by providing intelligent suggestions and automation.
-
Visual Paradigm Online: Create Stunning Infographics and Diagrams: An overview highlighting the platform’s versatility in producing both professional infographics and complex technical models.
-
Infographic Templates – Ready-to-Use Designs for Quick Creation: A library of professionally designed templates categorized by industry and use case to speed up the content creation process.
-
Best Infographic Design Tools – Compare Features & Benefits: A resource for comparing top design tools to help users identify the best software for their specific data visualization needs.
-
AI-Powered 3-Aspect Infographic Designer Tool: This release focuses on an AI tool that enhances design efficiency by utilizing three intelligent dimensions for instant generation.
-
Five Key Elements of Designing an Effective Infographic: A guide that identifies the essential components required to create engaging and informative visual data presentations.
-
InfoChart – Create Informative Charts and Infographics Easily: A specialized tool designed for creating clear, data-driven visuals and engaging infocharts for reports and presentations.
 vpadmin
- Uncategorized
- January 20, 2026