


1. Introduction
In today’s globalized economy, efficient and transparent package delivery systems are critical to customer satisfaction, business success, and supply chain reliability. Companies like UPS, FedEx, and DHL manage millions of deliveries daily, relying on robust, real-time tracking and intelligent decision-making.
To model such complex, event-driven workflows, UML Activity Diagrams provide a powerful and standardized approach. These diagrams go beyond simple flowcharts by capturing not only sequential steps but also control flow, decision points, loops, parallelism, and exception handling—making them ideal for modeling logistics operations.
This comprehensive case study explores the End-to-End Package Delivery Workflow using a PlantUML-based UML Activity Diagram, demonstrating how modern modeling techniques can be applied to real-world logistics systems. The study covers:
- The theoretical foundation of UML activity diagrams
- A detailed breakdown of the delivery process
- Design principles and best practices
- Common pitfalls and how to avoid them
- Practical tips for implementation using PlantUML
- Real-world integration and scalability considerations
The result is a production-ready, maintainable, and customer-centric model that reflects actual operational behavior, supports system design, training, and process optimization.
2. Why UML Activity Diagrams for Logistics?
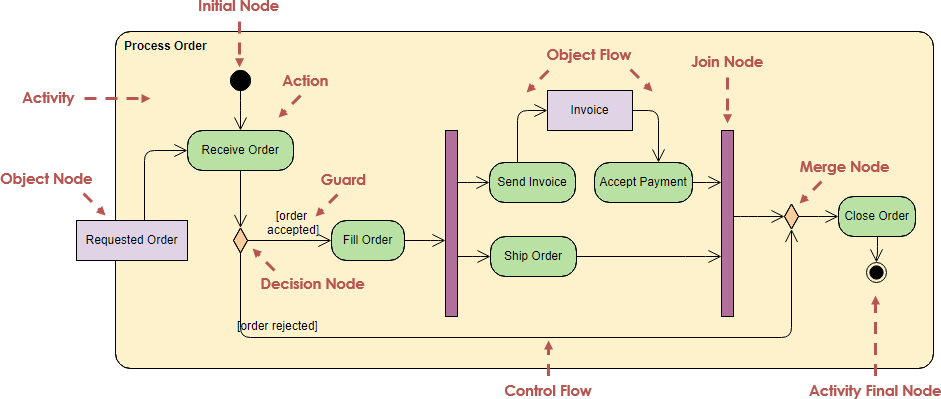
2.1 What Are UML Activity Diagrams?
UML (Unified Modeling Language) Activity Diagrams are part of the behavioral diagrams in UML, designed to model the dynamic flow of control within a system. They are particularly effective for:
- Business process modeling
- Workflow automation
- System operation sequencing
- Exception handling and concurrency
Unlike traditional flowcharts, UML activity diagrams include formal semantics and support advanced features like:
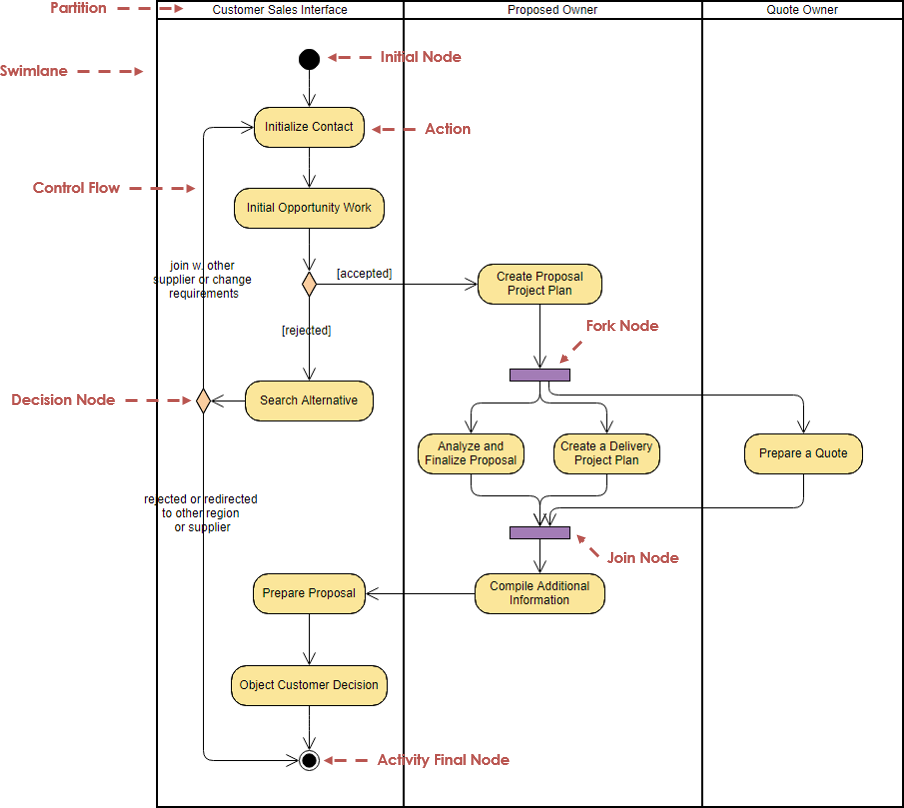
- Swimlanes (responsibility assignment)
- Fork/join nodes (parallelism)
- Object flows (data movement)
- Token-based execution (UML 2.x+)
These capabilities make them ideal for modeling real-time, multi-agent logistics systems where decisions depend on external events (e.g., GPS data, customer responses).
2.2 Why Activity Diagrams Over Other Models?
| Model | Best For | Limitation |
|---|---|---|
| Flowchart | Simple processes | Lacks formal semantics, poor scalability |
| State Machine | Object lifecycle | Not ideal for complex workflows with multiple actors |
| Activity Diagram | Process flows with decisions, loops, and concurrency | Requires understanding of UML semantics |
| Sequence Diagram | Interaction between objects | Less suitable for high-level workflow visualization |
✅ Conclusion: For end-to-end delivery workflows involving multiple stakeholders, conditional logic, retries, and event triggers, UML Activity Diagrams are the optimal choice.
3. The End-to-End Package Delivery Workflow
This section presents a realistic, production-grade model of a package delivery process, designed to reflect actual operational behavior observed in major courier services.

3.1 Core Requirements
The system must:
- Track packages from pickup to delivery
- Handle delays and rerouting
- Support multiple delivery attempts
- Notify customers at key stages
- Allow customer-initiated redirection
- Log all status changes for audit and transparency
- Be resilient to failures (e.g., no address, bad weather)
4. PlantUML Activity Diagram: Full Implementation
Below is the complete and annotated PlantUML code for the delivery workflow, using the modern beta syntax for enhanced readability and maintainability.
@startuml
skinparam {
  ArrowColor #424242
  ArrowFontColor #424242
  DefaultFontSize 14
  Swimlane {
    BorderColor #9FA8DA
    BackgroundColor #E8EAF6
    FontColor #303F9F
  }
  Activity {
    BorderColor #FF8F00
    BackgroundColor #FFECB3
    FontColor #3E2723
  }
  Decision {
    BorderColor #D32F2F
    BackgroundColor #FFEBEE
    FontColor #B71C1C
  }
  Final {
    BorderColor #388E3C
    BackgroundColor #C8E6C9
    FontColor #1B5E20
  }
  Initial {
    BorderColor #1976D2
    BackgroundColor #BBDEFB
    FontColor #1565C0
  }
}

' -------------------------------
' Initial Node
' -------------------------------
start
:Receive Shipment;
:Assign Tracking Number;
:Update Status to "In Transit";

' -------------------------------
' Main Loop: While Package Not Delivered?
' -------------------------------
while (Package Not Delivered?)
  :Check Current Location;
  if (Delay Detected?) then (yes)
    :Notify Customer of Delay;
    if (Customer Wants Redirection?) then (yes)
      :Update Delivery Address;
      :Recalculate Route;
    else (no)
      :Maintain Current Route;
    endif
  else (no)
    :Proceed to Next Hub;
  endif

  :Update Status to "Out for Delivery";

  if (Delivery Attempt Successful?) then ()
    :Update Status to "Delivered";
    :Record Delivery Confirmation;
    stop
  else (no)
    if (Attempt Limit Reached?) then (yes)
      :Update Status to "Delivery Failed";
      :Notify Customer for Reschedule;
      stop
    else (no)
      :Retry Delivery;
    endif
  endif
endwhile

stop
@enduml🔍 Note: This diagram uses modern PlantUML beta syntax, which eliminates dependency on Graphviz and supports better layout and styling.
5. Detailed Workflow Breakdown
Let’s walk through each phase of the delivery process, explaining the business logic, decision criteria, and real-world implications.
5.1 Phase 1: Intake and Initialization
| Step | Action | Purpose |
|---|---|---|
| 1 | Receive Shipment |
Package scanned at origin facility |
| 2 | Assign Tracking Number |
Unique ID generated (e.g., 1Z999AA1234567890) |
| 3 | Update Status to "In Transit" |
System marks package as en route |
📌 Key Insight: These actions are automated via scanning systems or API integrations. The tracking number enables real-time visibility.
5.2 Phase 2: Transit Monitoring Loop (while Package Not Delivered?)
This is the core loop of the workflow, simulating ongoing monitoring until delivery or failure.
Sub-Phase A: Location Check & Delay Detection
Check Current Location: Pulls GPS or hub data (e.g., via API).- Decision:
Delay Detected?- Condition: Delay > 2 hours past ETA (based on historical route data).
- Trigger: Real-time GPS drift, weather, traffic, or hub congestion.
🛠️ Implementation Tip: Use KPIs like On-Time Delivery Rate (OTDR) and Average Transit Time to define delay thresholds.
Sub-Phase B: Delay Response
- If yes →
Notify Customer of Delay- Sends push/email: “Your package is delayed due to weather. Expected delivery: tomorrow.”
- Then:
if (Customer Wants Redirection?)- If yes:
Update Delivery Address+Recalculate Route- Customer can redirect to a neighbor, post office, or locker.
- Triggers route optimization engine.
- If no:
Maintain Current Route
- If yes:
💡 Customer-Centric Design: This reflects modern courier apps (e.g., FedEx Delivery Manager, UPS My Choice), where customers have control and visibility.
Sub-Phase C: Normal Transit
- If no delay:
Proceed to Next Hub- Automatically updated via hub scanning or automated routing.
5.3 Phase 3: Delivery Attempt
After the package reaches the final delivery zone, the system enters the “Out for Delivery” phase.
Decision: Delivery Attempt Successful?
- Success:
Update Status to "Delivered"→Record Delivery Confirmation→stop- Confirmation stored in database (e.g., timestamp, signature, photo).
- Failure:
- Check:
Attempt Limit Reached?- If yes:
Update Status to "Delivery Failed"→Notify Customer for Reschedule→stop- Customer receives message: “Delivery failed. Please reschedule.”
- If no:
Retry Delivery→ Loop back toOut for Delivery
- If yes:
- Check:
🔄 Retry Logic: Typically 2–3 attempts per day. Retry delay: 2–4 hours.
📊 KPI Insight: High retry rates may indicate poor address validation or customer unavailability — a red flag for process improvement.
6. Key UML Concepts Applied
| UML Element | Role in Diagram | Real-World Example |
|---|---|---|
Initial Node (start) |
Entry point | Package scanned at pickup |
Actions (:action;) |
Steps in the process | “Notify Customer”, “Recalculate Route” |
| Control Flow (arrows) | Sequence of execution | From “Receive Shipment” to “Deliver” |
Decision Node (if ... then) |
Conditional branching | “Delay Detected?”, “Attempt Successful?” |
While Loop (while ... endwhile) |
Iterative monitoring | Loop until delivered or failed |
Final Node (stop) |
Termination | “Delivered” or “Delivery Failed” |
Color Coding (via skinparam) |
Visual semantics | Green = success, red = failure, yellow = delay |
| Token Semantics | Flow control | Only one token per path; ensures atomicity |
✅ Best Practice: Use one token per path to simulate real-world execution. Avoid ambiguous parallel flows unless concurrency is required.
7. Design Guidelines & Best Practices
7.1 General Principles
- Start simple: Begin with the happy path (no delays, no retries), then add exceptions.
- Use action verbs: Instead of “processing”, use “Notify Customer” or “Update Route”.
- Keep it readable: Limit nesting depth to 2–3 levels. Break complex flows into sub-diagrams.
- Align with real events: Ensure every action is triggered by a real-world event (e.g., GPS update, customer response).
7.2 Swimlane Best Practices (Optional Enhancement)
While not used in the base diagram, swimlanes can be added to assign responsibilities:
swimlane Customer
swimlane Driver
swimlane System

Customer : Receive Shipment;
Driver   : Assign Tracking Number;
System   : Update Status to "In Transit";
🔄 Benefit: Clarifies who does what — essential in multi-team logistics.
7.3 Traceability & Logging
Every status update must be:
- Loggable (e.g., timestamped in DB)
- Audit-ready (for compliance, disputes)
- Sync with customer app
📌 Example: “Out for Delivery” → triggers push notification to customer’s phone.
8. Common Pitfalls & How to Avoid Them
| Pitfall | Risk | Solution |
|---|---|---|
| Overcomplicating the diagram | Hard to read, error-prone | Use sub-activities or split into multiple diagrams |
| Vague actions (e.g., “process package”) | Ambiguity in implementation | Replace with specific verbs: “Scan package”, “Update route” |
| Ignoring retry logic | System fails silently | Explicitly model retry count and limit |
| No customer feedback loop | Missed redirection opportunities | Include Customer Wants Redirection? decision |
| Poor layout | Crossing arrows, messy flow | Use orthogonal layout, avoid diagonal flows |
| Misaligned with real data | Model doesn’t reflect reality | Validate with real delivery logs or APIs |
✅ Pro Tip: Use scenario testing — simulate:
- A 4-hour delay
- Customer redirects to a neighbor
- 3 failed attempts
- Successful delivery on 4th try
9. Tips & Tricks for PlantUML and Modeling
| Tip | Description |
|---|---|
| Start minimal | Build the happy path first, then layer in exceptions |
Use skinparam wisely |
Color-code paths: green = success, red = failure, yellow = delay |
Leverage note right |
Add explanations: note right of "Notify Customer of Delay": “Sent via SMS and email” |
Use alt for alternatives |
For complex branching: alt instead of if for multi-branch decisions |
| Export to SVG/PNG | Embed in Confluence, wikis, or documentation portals |
| Integrate with CI/CD | Store diagrams in Git, validate syntax via tools like plantuml CLI |
| Link to code | Use @startuml with !include to reference shared styles or components |
💡 Bonus: Use icons (via
!include) to make diagrams more visual (e.g., 🚚 for delivery, 📱 for customer).
10. Real-World Integration & Scalability
10.1 Integration with Real Systems
This activity diagram can be mapped directly to real-world systems:
- Tracking API: Status updates via REST/GraphQL
- SMS/Email Service:
Notify Customer→ Twilio or SendGrid - Routing Engine:
Recalculate Route→ Google Maps API, HERE, or in-house algorithms - Database:
Record Delivery Confirmation→ PostgreSQL, Firebase - Customer App: Push notifications, rescheduling forms
10.2 Scalability Considerations
- Parallel Processing: Add
fork/joinnodes for multi-hub routing or multi-destination deliveries. - Microservices Architecture: Break the workflow into services:
Tracking ServiceNotification ServiceRouting EngineDelivery Scheduler
- Event-Driven Design: Use Kafka or AWS SNS/SQS to trigger actions (e.g., “Delay Detected” → publish event).
10.3 KPIs & Monitoring
Integrate with observability tools:
- Delivery Success Rate = (Delivered / Total Attempts) × 100
- Retry Rate = (Retry Attempts / Total Deliveries)
- Average Delivery Time
- Customer Satisfaction (CSAT) from post-delivery surveys
📈 Insight: High retry rates may signal issues in address validation or customer availability — prompting process redesign.
11. Conclusion: Why This Model Matters
The End-to-End Package Delivery Workflow modeled via UML Activity Diagrams is more than a visual aid — it’s a strategic tool for:
- System Design: Guides developers on how to implement delivery logic.
- Training & Onboarding: Helps new employees understand the delivery lifecycle.
- Process Optimization: Highlights bottlenecks, retry loops, and failure points.
- Customer Communication: Ensures every status change is meaningful and actionable.
- Transparency & Trust: Customers see the logic behind delays and rescheduling.
🎯 Final Takeaway:
Well-designed activity diagrams bridge business logic and technical implementation.
They transform complex, event-driven logistics into a clear, traceable, and customer-centric process — a cornerstone of modern supply chain excellence.
12. Future Enhancements
To evolve this model further:
- Add swimlanes for stakeholder roles (Customer, Driver, System)
- Introduce parallel forks for multi-drop deliveries
- Integrate AI-based delay prediction using historical data
- Implement auto-redirection based on customer preferences
- Add escalation paths for unresolved failures (e.g., return to sender)
13. Resources & References
- UML 2.5 Specification – Object Management Group (OMG)
- PlantUML Documentation – https://plantuml.com/
- Real-World Courier APIs:
- FedEx API: https://developer.fedex.com
- UPS API: https://www.ups.com/developers
- Case Studies:
- “How FedEx Uses Real-Time Tracking to Improve Delivery” – FedEx Newsroom
- “DHL’s Digital Transformation in Logistics” – DHL Insights
14. Final Words
In a world where speed, reliability, and transparency define customer experience, modeling delivery workflows with UML Activity Diagrams is not just beneficial — it’s essential.
This case study demonstrates how a simple, well-structured diagram can capture the complexity of real-world logistics, support system development, and empower organizations to deliver better, faster, and smarter.
🚚 From concept to delivery — clarity starts with a diagram.
✅ Download the PlantUML Code
Save the code above asdelivery_workflow.pumland render it using:java -jar plantuml.jar delivery_workflow.puml
📌 Use this model in your next project — and deliver with confidence.
Resouces
- Free Online Activity Diagram Tool | Visual Paradigm: This is a web-based solution for visualizing workflows and business processes without requiring software installation.
- What Is an Activity Diagram? | UML Guide by Visual Paradigm: An in-depth guide explaining the purpose, components, and use cases of activity diagrams in modeling system workflows.
- Activity Diagram Tutorial | Step-by-Step Guide | Visual Paradigm: A comprehensive tutorial designed for beginners to learn how to model complex workflows using step-by-step instructions.
- Activity Diagrams in Software Design | Visual Paradigm Handbook: A detailed handbook section on using activity diagrams to map out system behavior and decision points effectively.
- Mastering UML Activity Diagrams with AI | Visual Paradigm Blog: This post explores how AI-powered features enhance the creation and optimization of activity diagrams for developers and analysts.
- Generate Activity Diagrams from Use Cases Instantly with Visual Paradigm’s AI: This resource highlights how the AI engine enables rapid and accurate conversion of use cases into professional diagrams.
- Mastering Swimlane Activity Diagrams: A Practical Guide with Examples: A guide focused on creating swimlane diagrams to visualize workflows across different roles or departments.
- Convert Use Case to Activity Diagram – AI-Powered Transformation: Details an AI transformation tool that automatically converts use case diagrams into detailed activity diagrams.
- Advanced Activity Diagram Software Features | Visual Paradigm: An overview of powerful tool capabilities, including real-time collaboration and extensive export options.
- Activity Diagram Guide | Visual Paradigm User Manual: A technical reference in the user manual covering all aspects from basic diagram creation to advanced modeling.
 curtis
- AI, AI Chatbot, UML
- February 3, 2026