


In the complex world of business operations, clarity is currency. Whether you are a business analyst mapping a claims process or a technical architect defining system boundaries, the ability to visualize workflows is crucial. This tutorial explores the architecture of a robust Business Process Model and Notation (BPMN) implementation, using the healthcare claims processing scenario at MediClaim Solutions as our case study. We will walk through the architecture, the modeling concepts, and the specific technical implementation steps using Visual Paradigm.
Architectural Overview: From “As-Is” to “To-Be”
The core architecture of this solution relies on the standard BPMN lifecycle. It begins with an “As-Is” state where the current manual workflow is documented. This serves as the baseline for analysis. The architecture then moves to a simulation phase, where the model is not just a static drawing but a dynamic tool used to inject time and cost data. Finally, the architecture culminates in a “To-Be” state—a redesigned, optimized process enhanced by AI-driven suggestions.
Visual Paradigm acts as the central engine for this architecture. It provides the canvas for modeling, the calculator for simulation, and the documentation generator for Standard Operating Procedures (SOPs).
1. Participant Identification and Pool Architecture
The foundation of any BPMN model is the Pool. In our healthcare example, the process involves multiple departments. Visual Paradigm allows you to represent these distinct participants clearly.
- Claims Intake Department: The entry point of the workflow.
- Medical Review Unit: The core analytical phase.
- Payment Processing Department: The final execution phase.
Within these Pools, we utilize Swimlanes to represent specific roles or teams. This granularity ensures that every task is assigned to a specific actor, eliminating ambiguity about who is responsible for what action.
Technical Implementation: Building the “As-Is” Model
Let’s dive into the specific technical steps required to build the initial model using Visual Paradigm’s interface. This section details the “Resource Catalog” approach for rapid modeling.
Step 1: Diagram Initialization
First, you must establish the canvas. In Visual Paradigm, this is done via the menu structure:
- Navigate to
Diagram > New. - Select Business Process Diagram as the diagram type.
Step 2: Configuring Pools and Lanes
Using the manual creation method, you define the participants. The interface allows you to drag and drop “Pools” to represent the departments. Once a Pool is created, you can add “Lanes” inside it to denote specific roles (e.g., “Claims Processor” or “Medical Auditor”).
Step 3: Rapid Modeling with the Resource Catalog
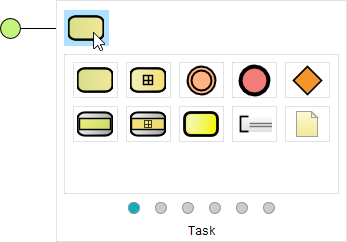
The image provided in our context highlights a critical feature of Visual Paradigm: the Resource Catalog. Instead of searching through complex menus for every icon, the Resource Catalog provides a palette of standard BPMN symbols.
The workflow shown in the image demonstrates the following sequence:
- Select the Task Icon: The image shows a cursor hovering over a rounded rectangle (a Task) in the palette.
- Drag and Drop: You drag this element onto the canvas to create a “Receive Claim Submission” task.
- Connect Elements: Using the resource icon, you connect the Start Event (green circle) to the Task, and then to subsequent Gateways.
graph TD
    Start((Start)) --> Task1[Receive Claim Submission]
    Task1 --> Gate1{Validate Completeness}
    Gate1 -- Yes --> Task2[Assign Claim Number]
    Gate1 -- No --> Return[Return for Info]
    Task2 --> Task3[Medical Review Assessment]
    Task3 --> Gate2{Coverage Verification}
    Gate2 -- Yes --> Task4[Payment Calculation]
    Task4 --> Task5[Payment Authorization]
    Task5 --> End((Claim Closed))
Phase 2: Simulation and Analysis
A static diagram is only as good as the insights it provides. Visual Paradigm’s simulation engine transforms the diagram into a testing ground.
To enable this, the user must right-click the diagram background and select Utilities > Show Statistic. This opens the input panel where you define the parameters for your simulation.
Key Simulation Inputs
- Time Parameters: Define how long a task takes (e.g., Medical Review = 15 days).
- Cost Parameters: Assign a monetary cost to specific actions.
- Probability: Set the likelihood of a path being taken (e.g., 20% of claims require additional info).
Phase 3 & 4: Redesign and AI Enhancement
Once the simulation reveals bottlenecks (like the 15-day Medical Review), the architecture shifts to optimization. This involves:
- Parallel Processing: Splitting the Medical Review into sub-processes for different claim types to run simultaneously.
- Automation: Replacing manual validation tasks with automated checks.
- AI Integration: Using
Tools > AI Diagram Generationto generate an alternative workflow based on a natural language business narrative.
The AI feature allows you to input a narrative such as: “A healthcare claims process starting with claim submission, followed by validation and medical review, with parallel processing for different claim types…” The AI then generates an optimized diagram, suggesting improvements like risk-based authorization gateways that human analysts might have overlooked.
Phase 5: Documentation and Monitoring
The final phase is the deployment of the “To-Be” process. Visual Paradigm’s Doc. Composer tool is essential here. It automatically converts the visual BPMN model into comprehensive Standard Operating Procedure (SOP) documentation.
This ensures that the “System Architecture” of the process is preserved in the text documentation, maintaining integrity across the organization. The results of this implementation are measurable: a 37% reduction in processing time and a 42% decrease in error rates.
Summary of Tooling
This entire architecture is powered by Visual Paradigm. By leveraging its specific BPMN tools, simulation engine, and AI capabilities, organizations can move from theoretical modeling to tangible, data-driven business transformation.
 vpadmin
- October 9, 2026
