


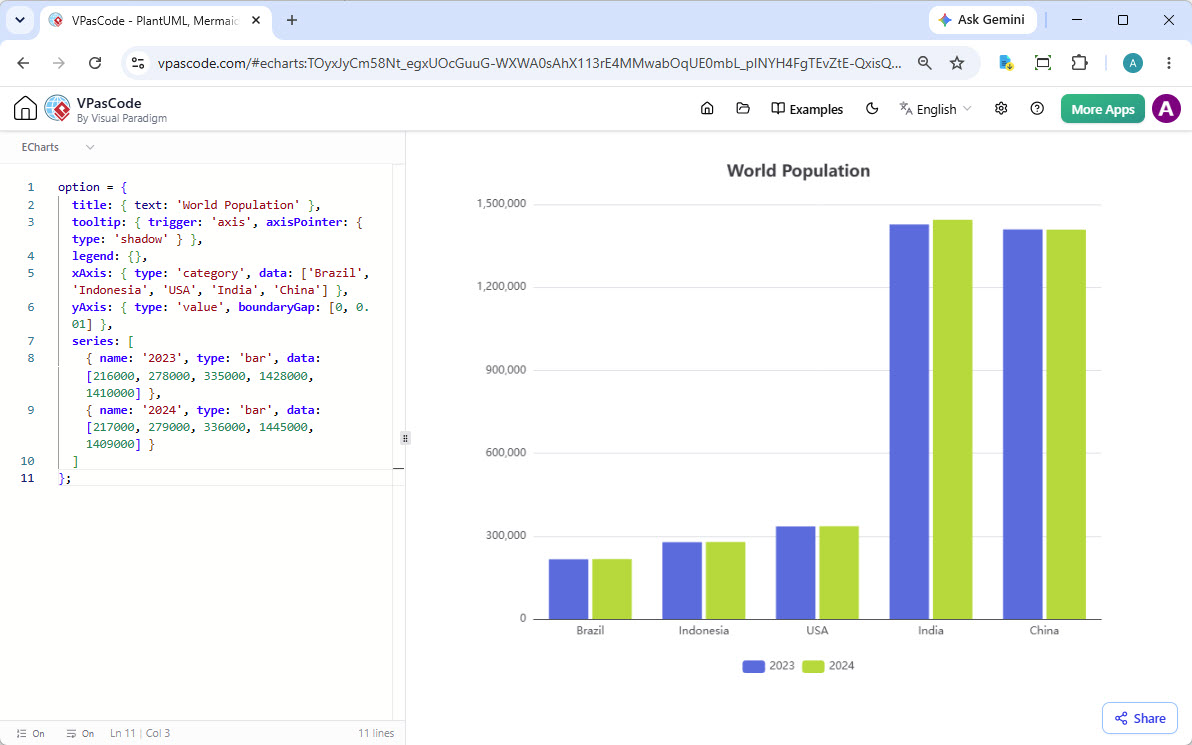
In the modern landscape of software engineering and data analysis, the ability to translate raw numbers into compelling visual narratives is a critical skill. VPasCode by Visual Paradigm bridges the gap between abstract modeling and concrete implementation by allowing developers to define complex visualizations directly through code. In this tutorial, we will deconstruct the architecture behind the “World Population” chart shown in the screenshot, breaking down the configuration object that drives the visualization engine.
This article serves as a technical deep-dive into how to structure data, configure axes, and manage series in ECharts using VPasCode, ensuring your diagrams are not just static images, but interactive tools.
Understanding the ECharts Configuration Object
The core of any ECharts visualization is the option object. This is a JavaScript-based configuration structure that tells the rendering engine exactly how to draw the chart. It is a hierarchical structure where every property acts as a directive.
1. Title and Tooltip Configuration
At the top level, we define the global appearance. The title property sets the main heading, while the tooltip property controls the interactivity. When a user hovers over a data point, the tooltip appears.
option = {
  title: { text: 'World Population' },
  tooltip: {
    trigger: 'axis',
    axisPointer: { type: 'shadow' }
  },
  legend: {}
}trigger: ‘axis’: This is a crucial setting for bar charts. It means that hovering over the X-axis line triggers the tooltip for all bars at that specific point (e.g., hovering over “India” shows data for both 2023 and 2024).axisPointer: { type: ‘shadow’ }: This adds a visual guide (a shadow line) on the axis where the mouse is currently located, improving user experience.
2. Axis Configuration (The Foundation)
Every chart needs a coordinate system. ECharts separates the horizontal axis (xAxis) and the vertical axis (yAxis).
xAxis: {
  type: 'category',
  data: ['Brazil', 'Indonesia', 'USA', 'India', 'China']
},
yAxis: {
  type: 'value',
  boundaryGap: [0, 0.01]
}
Notice the distinction in types:
- X-Axis (Category): This is used for qualitative data—labels like country names. The
dataarray defines the labels on the horizontal ruler. - Y-Axis (Value): This is used for quantitative data. The
type: 'value'automatically scales the chart based on the numerical range of your data.
3. Series Definition (The Data)
The series array is the heart of the chart. It contains the actual datasets. In this example, we are visualizing two distinct years (2023 and 2024) side-by-side for each country.
series: [
  {
    name: '2023',
    type: 'bar',
    data: [216000, 278000, 335000, 1428000, 1410000]
  },
  {
    name: '2024',
    type: 'bar',
    data: [217000, 279000, 336000, 1445000, 1409000]
  }
]
Key technical details here include:
- Bar Type: Setting
type: 'bar'explicitly instructs the renderer to create vertical bars. - Data Alignment: The order of numbers in the
dataarray corresponds strictly to the order of labels in thexAxisdataarray. Index 0 in the series matches Index 0 in the axis (e.g., the first number corresponds to Brazil).
Advanced Styling and Rendering
While the code above produces a functional chart, VPasCode allows you to extend this further. For instance, the boundaryGap: [0, 0.01] setting in the Y-axis is a subtle but powerful trick. It removes the gap at the bottom of the chart, allowing the bars to touch the X-axis line flush, which is often preferred for precise data comparison.
By mastering the structure of the option object, you move beyond using drag-and-drop tools and gain full programmatic control over your data visualization, enabling dynamic updates and complex logic that static tools cannot support.
 vpadmin
- November 3, 2026
