


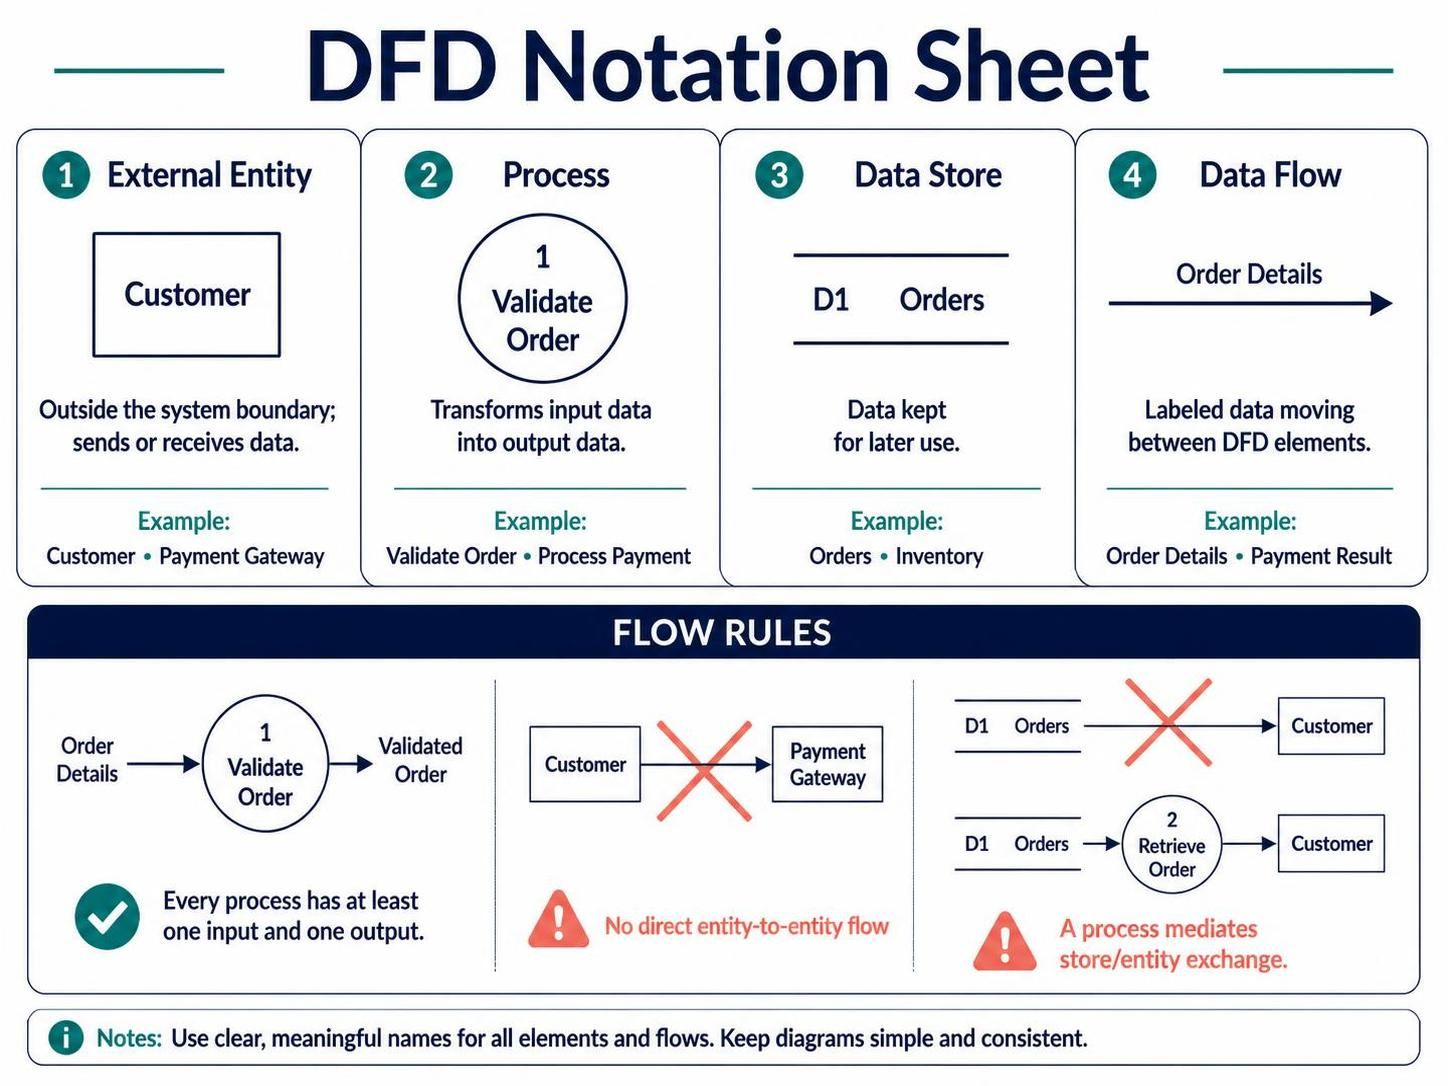
When architects and business analysts begin to model complex software systems, they often face a choice between describing how a system works (logic, loops, control flow) and what data moves through it. For high-level architecture, clarity is king. This is where the Data Flow Diagram (DFD) shines. Unlike a flowchart, which dictates the sequence of events, a DFD focuses purely on the movement and transformation of information.
Based on the principles of the DFD Notation Sheet, this tutorial will guide you through the four pillars of DFD modeling, the strict rules governing data flow, and how to use modern tooling like Visual Paradigm to visualize your system’s data integrity.
The Core Philosophy: Data Over Control
Before drawing a single box or arrow, it is crucial to internalize what a DFD is not. It is not a flowchart. It does not care about if-else statements, loops, or the specific order of operations unless that order fundamentally affects the transformation of data.
Instead of “verbs” in a timeline, DFDs look at the system as a Black Box. Initially, the system is opaque; we only care about its interface with the outside world. We treat the internal logic as a series of transformations that must take raw input and turn it into meaningful output.
The Four Pillars of DFD Notation
To build a valid Data Flow Diagram, you must strictly adhere to the four fundamental elements. These are the building blocks that define the architecture of information.
1. External Entity (The Actors)
These represent the sources or destinations of data. They exist outside the system boundary. They are the “who” in your system.
- Examples: Customer, Payment Gateway, HR Department.
- Role: They trigger the system or consume its final output.
2. Process (The Transformation)
Processes are the verbs of your system. They represent a transformation of data. If data passes through a bubble unchanged, it is not a process; it is just a flow.
- Rule: Every process must have at least one input and one output. You cannot have a process that takes nothing and produces something.
- Examples: Validate Order, Calculate Tax, Transform Image.
3. Data Store (The Nouns at Rest)
A data store represents data that is kept for later use. These are the nouns of your system—the physical or logical containers where information rests.
- Examples: Database tables (Orders), Files (Log.txt), Inventory Lists.
- Key Constraint: Data stores cannot connect directly to External Entities. Data must always flow through a process to be saved or retrieved.
4. Data Flow (The Arrows)
The arrows represent the labeled packets of information moving between the elements. They are the “data” in Data Flow Diagram.
- Rule: Every arrow must be labeled clearly. “Data” is too vague; “Customer ID” or “Order Details” is required.
- Direction: The arrow indicates the direction of the data packet.
Flow Rules: The Integrity Check
Modeling a system is like conducting a financial audit. The concept of Balancing ensures that data is neither created nor destroyed out of thin air. The “money” (data) going into a department (parent process) must equal the money accounted for in its sub-departments (child processes).
To ensure your diagram is valid, you must follow these specific flow rules illustrated in standard notation:
- The Input/Output Rule: Every process must have at least one input and one output. A process that only receives data or only outputs data is invalid.
- No Direct Entity-to-Entity Flow: Two external entities cannot talk to each other directly. All communication must be mediated by the system (the process).
- The Mediation Rule: A process must mediate any exchange between a Data Store and an External Entity. You cannot write directly to a database table from a user, nor read directly from a table to a user without a process handling the logic.
Modeling with Visual Paradigm and AI
Modern architecture relies on tools that enforce these rules automatically. When using Visual Paradigm (VPasCode) combined with AI assistance, the modeling process shifts from manual drawing to logical definition.
AI-assisted modeling allows you to define the system context naturally, while the tool ensures that you haven’t created a “spaghetti” diagram where data flows violate the core rules. For instance, if you attempt to draw a direct line from a “Customer” to a “Database,” the tool should flag this as an error, prompting you to insert a “Validate” process in between.
Conclusion
A well-constructed Data Flow Diagram provides a clear, unambiguous view of your system’s architecture. By focusing on the flow of data rather than the control logic, you can create models that are easier to understand, easier to debug, and easier to communicate to stakeholders. Remember: every process transforms, every store saves, and every flow is labeled.
 vpadmin
- November 5, 2026
