


In the realm of software architecture and system design, clarity is currency. A complex system can be misunderstood in seconds if its logic is not visually articulated. This tutorial explores the fundamental building blocks of flowcharting, utilizing the powerful combination of Visual Paradigm Flowchart and AI-driven tools like VPasCode to bridge the gap between abstract logic and concrete diagrams.
Understanding how to structure a flowchart is not just about drawing shapes; it is about defining the narrative of a process. Whether you are mapping a simple data validation routine or a complex enterprise workflow, adhering to standard symbols and core principles ensures that your documentation remains universally understood by developers, stakeholders, and business analysts.
The Anatomy of a Flowchart: Core Symbols
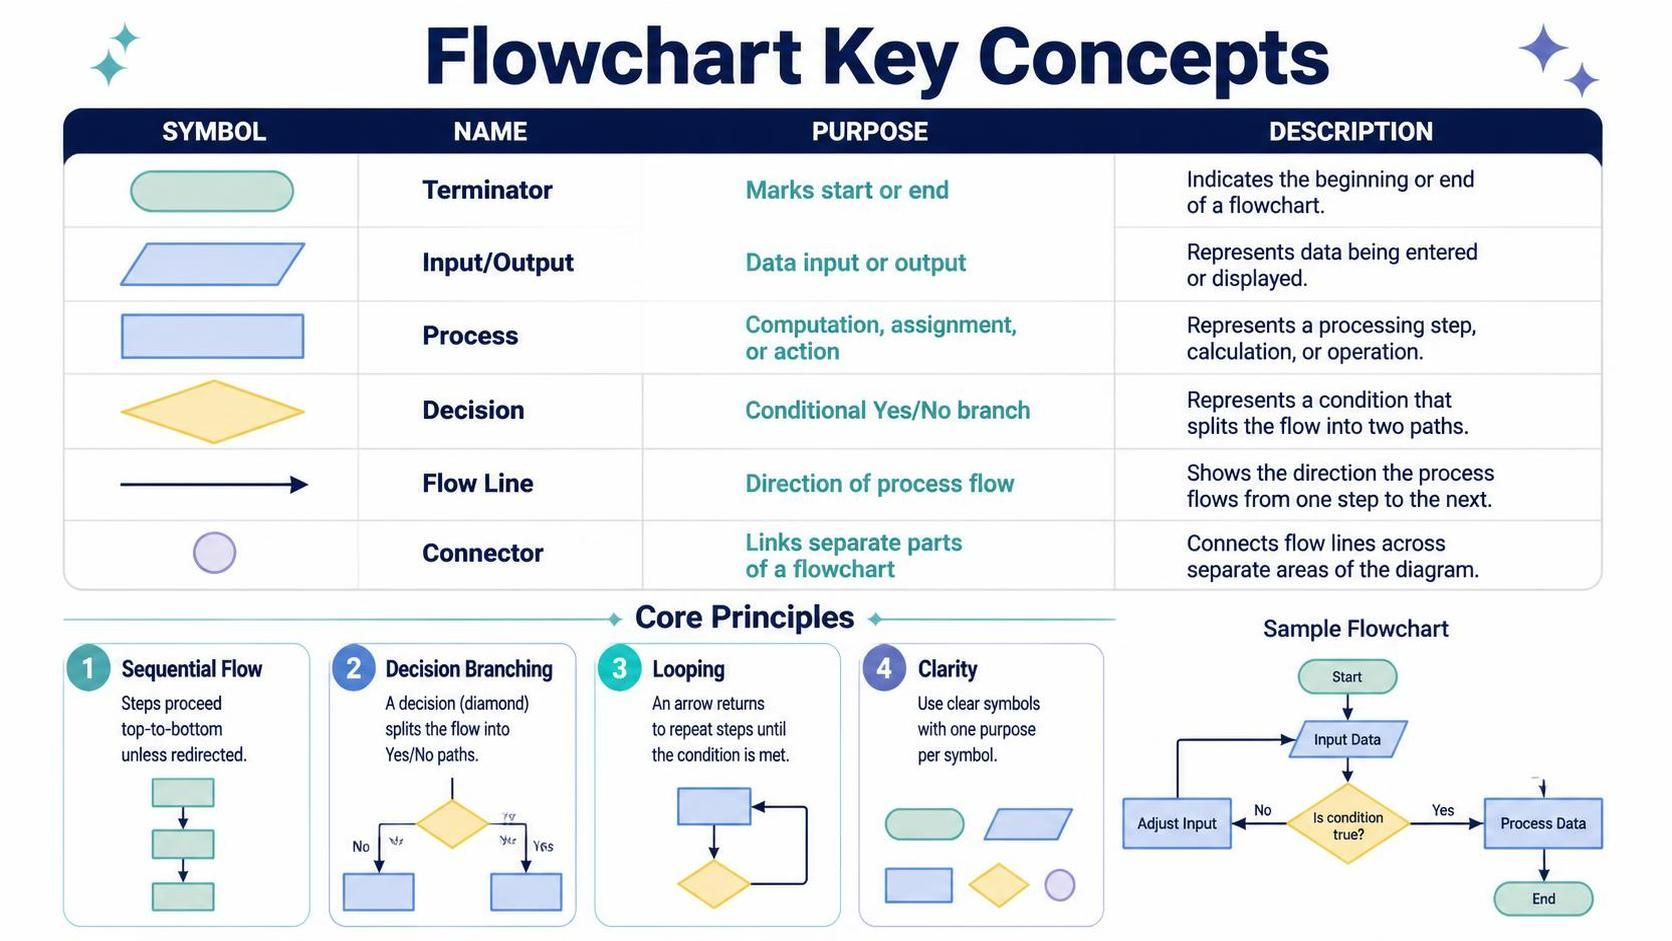
The language of flowcharts is standardized. Visual Paradigm adheres to these international standards (such as ISO 5807) to ensure consistency. Before constructing your first model, it is essential to internalize the five primary symbols that act as the vocabulary of your diagram.
1. The Terminator (Oval)
The Terminator serves as the anchor of your flowchart. It is the entry and exit point of the process. In a system architecture context, this represents the trigger event (Start) or the finalization of a transaction (End). It defines the boundaries of the system scope.
2. The Input/Output (Parallelogram)
When a system interacts with the outside world, it uses the Input/Output symbol. This is distinct from internal processing. It represents data entering the system (e.g., user login credentials) or data leaving the system (e.g., generating a PDF report). In VPasCode, these are often represented as data interfaces.
3. The Process (Rectangle)
The Process symbol is the workhorse of the diagram. It denotes any action, computation, or assignment that changes the state of the data. If the system is performing a calculation, updating a database, or executing an algorithm, it resides within this rectangle.
4. The Decision (Diamond)
Logic is impossible without the Decision symbol. This diamond shape represents a conditional branch where the flow splits based on a boolean condition (Yes/No, True/False). It is the critical node that introduces branching paths into your architecture.
5. Flow Lines and Connectors
The Flow Line (Arrow) dictates the temporal sequence of events, while the Connector (Circle) is used to link separate parts of a diagram that may be spread across multiple pages or sections, maintaining logical continuity without cluttering the visual space.
Core Principles of Logical Modeling
Once the symbols are mastered, the next challenge is applying them through the four core principles of flowcharting. These principles ensure that the resulting diagram is not only accurate but also maintainable.
- Sequential Flow: By default, processes execute top-to-bottom. This linear progression should be the baseline for your diagram. If a step must happen before another, the flow line connects them directly.
- Decision Branching: When a condition is met, the flow must split. A decision point should ideally have two distinct paths (True/False or Yes/No) to ensure the logic is exhaustive.
- Looping: Complex systems often require repetition. An arrow looping back from a later stage to an earlier stage allows the system to iterate until a specific condition is met (e.g., “Retry until valid input is received”).
- Clarity: Each symbol should have a single, clear purpose. Avoid “swiss army knife” symbols where a process tries to do everything at once. Modularity is key to a clean architecture.
To visualize the standard representation of these elements within a VPasCode syntax structure, consider the following conceptual breakdown:
@startuml
' Conceptual Structure of a Standard Flow
start
:Initialize System;
:Input Data;
if (Is Condition True?) then (yes)
    :Process Valid Data;
    stop
else (no)
    :Adjust Input;
    endif
@enduml
In this conceptual snippet, notice how the if statement corresponds directly to the Diamond symbol, splitting the flow into the “yes” and “no” paths. This syntax is what VPasCode interprets to generate the visual diagram.
Advanced Modeling with VPasCode and AI
Visual Paradigm has evolved from a pure drawing tool to an intelligent modeling environment. By integrating AI capabilities, users can move from manual drag-and-drop to semantic modeling. The VPasCode tool allows users to describe their system architecture using text-based logic, which the AI then renders into a professional flowchart.
When modeling complex systems, the AI can assist in:
- Pattern Recognition: Identifying redundant loops or unconnected decision branches.
- Refactoring: Suggesting cleaner paths for complex decision trees.
- Documentation: Automatically generating text descriptions for each symbol based on the diagram structure.
This approach ensures that your diagrams remain synchronized with your codebase. If the logic in your VPasCode definition changes, the diagram updates instantly, preserving the integrity of your system architecture documentation.
Conclusion
Mastering flowcharts is about mastering the art of simplification. By strictly adhering to the symbols of Terminators, Inputs, Processes, and Decisions, and applying the principles of sequential flow and clarity, you create a blueprint that is robust and scalable. Whether you are sketching on a whiteboard or generating diagrams via VPasCode, these core concepts provide the foundation for effective system architecture.
 vpadmin
- November 9, 2026
