


Data Flow Diagrams (DFDs) are the backbone of structured system analysis, offering a visual representation of how data moves through an information system. However, the true power of DFDs lies not just in drawing a single picture, but in the rigorous process of decomposition and balancing. This tutorial explores the critical concept of maintaining consistency between different levels of abstraction—Level 0 (Context), Level 1, and Level 2—using the capabilities of the Visual Paradigm DFD ecosystem.
The Hierarchy of System Modeling
When modeling complex systems, a single diagram rarely captures the necessary detail. Instead, we use a hierarchical approach. The Context Diagram, or Level 0, provides the “bird’s-eye view,” representing the entire system as a single black box process. It identifies the boundaries of the system by showing external entities and the major data streams entering or leaving the system.
As we drill down, we create Level 1 and Level 2 diagrams. These lower-level diagrams decompose the single process of the parent diagram into its constituent sub-processes. This decomposition allows analysts to define the internal logic of the system without getting bogged down in the macro-level overview.
Visualizing the Decomposition
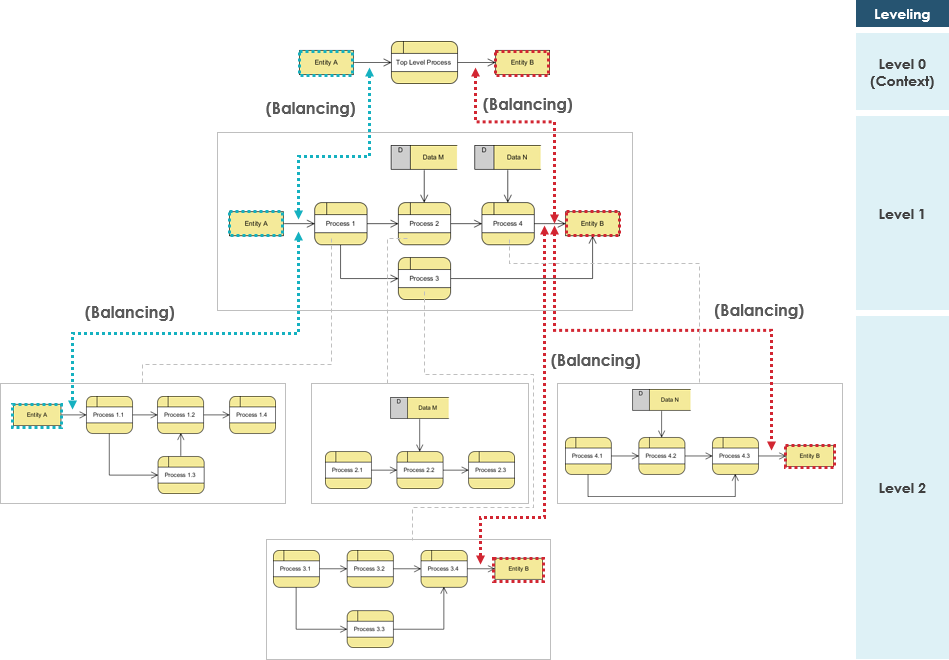
In our reference architecture, observe the relationship between the Top Level Process and the subsequent detailed flows. The visual style often distinguishes these levels. For instance, a Context Diagram might use a single rounded rectangle to represent the system, while Level 1 breaks this into specific processes like Process 1, Process 2, and so on. The key to a successful DFD is ensuring that these layers are not just visually related, but mathematically and logically identical in terms of data flow.
The Golden Rule: Balancing
The most critical concept in multi-level DFDs is Balancing. Balancing is the practice of ensuring that the inputs and outputs of a parent process are identical to the sum of the inputs and outputs of the child processes in the next lower level. It is a strict conservation law of data.
If a parent process receives “Order Data” from an external entity, that specific data flow must appear in the child diagram. It cannot disappear. Conversely, if a child process generates a “Receipt,” that data flow must be accounted for in the parent diagram. If you fail to balance your diagrams, the system design is logically flawed.
Tracing Data Integrity
Let’s look at how this balancing act works in practice using the visual cues found in advanced modeling tools like Visual Paradigm:
- Input Conservation: In the diagram, notice the dashed arrow connecting Entity A to the top-level process. When we zoom into Level 1, we see Process 1 receiving data from Entity A. If we drill down further to Level 2, we see Process 1.1 receiving that same input. The data source has not changed; only the processing has refined.
- Output Conservation: Similarly, observe the flow to Entity B. At Level 0, it is a single stream. At Level 1, we see Process 4 handling the output. At Level 2, we see Process 4.1 and Process 4.3 handling the detailed logic, but the final output destination remains Entity B.
The red and teal dashed lines labeled “(Balancing)” in architectural diagrams serve as visual guides. They explicitly trace the flow from the high-level abstraction down to the granular details, ensuring that no data is lost in the translation between levels.
Advanced Techniques for Complex DFDs
As systems grow, managing the complexity of multiple levels can become challenging. Visual Paradigm and similar tools offer specific strategies to maintain clarity while adhering to the rules of DFD modeling.
The 7 +/- 2 Rule
Human cognitive limits suggest that a person can only hold a certain number of items in their working memory. In DFD design, this translates to the 7 +/- 2 rule. A single DFD should ideally contain between 5 and 9 processes. If a diagram exceeds this, it becomes too complex for a human analyst to understand effectively. This is why we must decompose the system into lower levels.
Duplicate Entities and the Asterisk
One common issue in complex systems is the “Crossing Lines” problem. To keep diagrams readable, you should avoid having lines cross over one another. Sometimes, this requires duplicating an entity or a data store on the diagram. However, duplicating elements can confuse the model. To handle this, industry standards dictate that if you must duplicate an entity or store to improve layout, you should mark it with an asterisk (*) or a similar notation to indicate that it is a copy of the original element, not a new, distinct entity.
Step-by-Step: Implementing Balancing in VPasCode
When using VPasCode (Visual Paradigm Script) to generate these diagrams, you must explicitly define the flow in a way that the tool understands the hierarchy. You define the parent, and then the tool generates the children, but you must ensure the data flows match.
Here is a conceptual breakdown of how you might structure the logic for a balanced DFD using VPasCode syntax:
// Define the Context Level (Level 0)
Process SystemMain:
  Input: OrderRequest from Customer
  Output: Invoice to Customer

// Define Level 1 Decomposition
Process 1.0 (Sub-process of SystemMain):
  Input: OrderRequest from Customer
  Output: OrderDetails to Database

Process 2.0 (Sub-process of SystemMain):
  Input: OrderDetails from Database
  Output: Invoice to Customer

// Verify Balancing
// The inputs to 1.0 and 2.0 combined must equal the input to SystemMain.
// The outputs from 1.0 and 2.0 combined must equal the output from SystemMain.
This logical structure ensures that when the tool renders the diagram, the “Balancing” connections are mathematically valid.
Naming Conventions and Uniqueness
To maintain clarity, every entity and process within a specific level must have a unique name. If you have a “Customer” entity in Level 1, you cannot have a different “Customer” entity in Level 2 unless they are distinct and marked as such. Furthermore, a hierarchical numbering convention (1, 1.1, 1.1.1) is essential. This numbering system provides a quick reference to trace exactly where a specific process fits within the overall system architecture.
Conclusion
Data Flow Diagrams are more than just drawings; they are a rigorous language for describing system behavior. By adhering to the principles of balancing, managing complexity through decomposition, and utilizing tools like VPasCode to enforce consistency, you can create robust system architectures that are easy to understand and maintain. Whether you are designing a simple inventory system or a complex enterprise application, the logic remains the same: ensure that what goes in comes out, and document every step along the way.
 vpadmin
- November 17, 2026
