


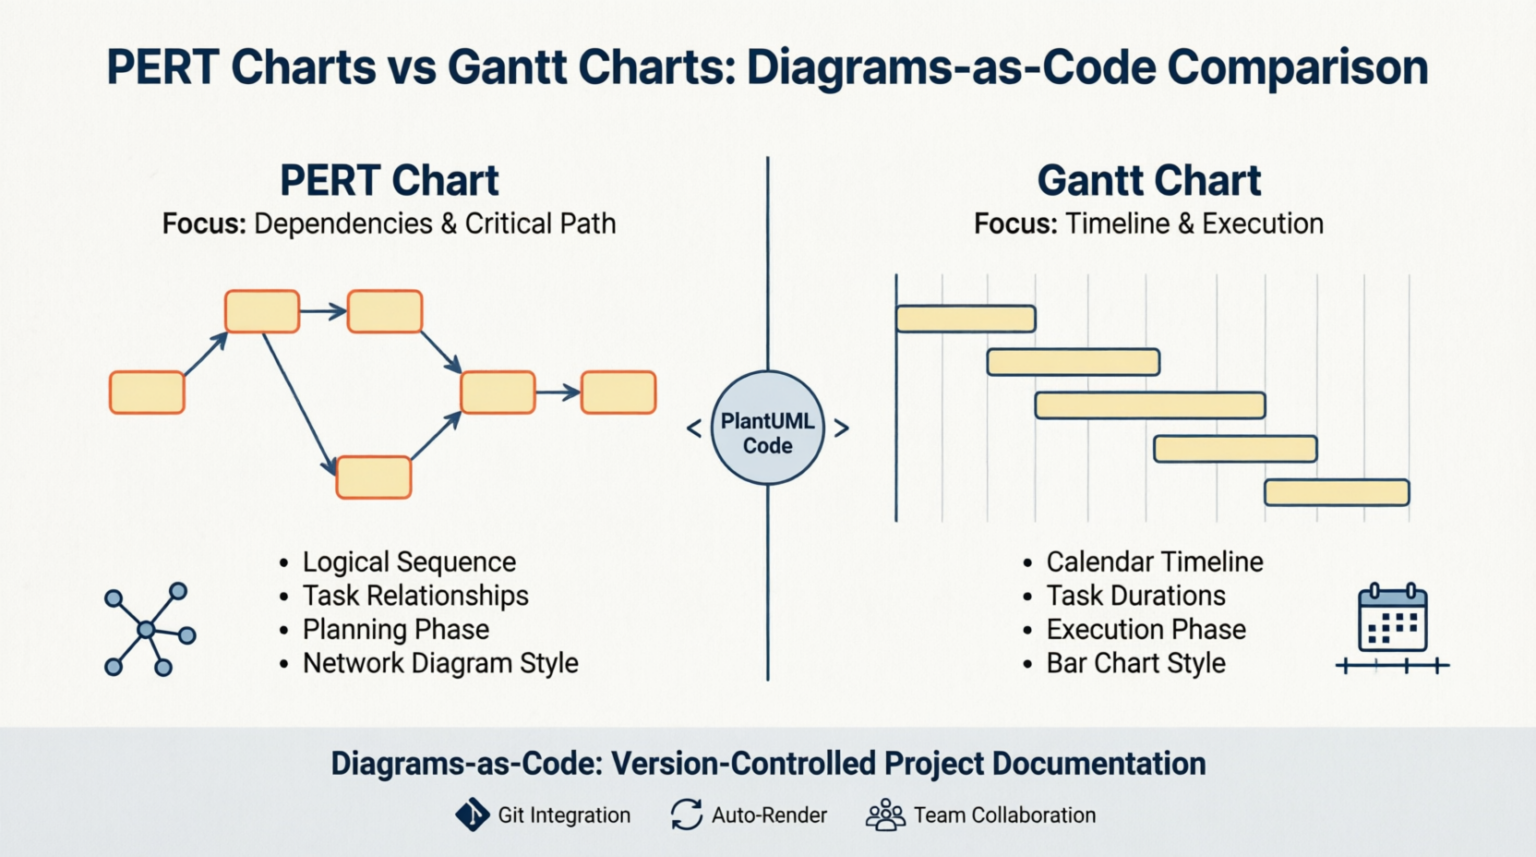
In the modern landscape of software development and project management, the demand for transparency and version control has shifted documentation from static images to dynamic code. Traditional drag-and-drop tools often create information silos, making it difficult to maintain complex project dependencies or integrate diagrams into development workflows. This is where the “Diagrams-as-Code” methodology shines.
This tutorial explores how to leverage PlantUML to build robust PERT (Program Evaluation Review Technique) and Gantt charts. By treating visual documentation with the same rigor as software source code, project managers can ensure that diagrams remain synchronized with project plans and enable seamless integration into CI/CD pipelines.
1. PERT Charts vs. Gantt Charts: Core Concepts
Before diving into implementation, it is crucial to understand when and why to use each chart type. While both serve project planning purposes, they address fundamentally different questions.
The PERT Chart: Logic and Critical Paths
A PERT chart is a network diagram used primarily during the planning phase of a project. It focuses on the logical sequence of tasks, identifying the relationships between them and determining the “critical path”—the longest stretch of dependent activities that dictates the shortest possible project duration.
- Best Use: Planning complex projects with uncertain task durations.
- Focus: Task dependencies and logical flow.
- Visual Style: Nodes and arrows representing a network.
The Gantt Chart: Timeline and Execution
A Gantt chart is a bar chart that maps tasks to a calendar grid. It is the industry standard for the execution phase, allowing managers to track progress against a specific timeline and manage resource loading.
- Best Use: Executing and tracking day-to-day project progress.
- Focus: Chronological timeline and task durations.
- Visual Style: Horizontal bars mapped to a time scale.
2. Guide to Building PERT Charts in PlantUML
To create a PERT chart in PlantUML, we treat project tasks as objects in a sequence. This approach allows us to embed critical scheduling metadata directly into the visual nodes.
Key Syntax Rules
1. Define Nodes as Objects
Use the syntax object "Task Name" as alias to define milestones or tasks. The alias allows for clean referencing in connections.
2. Embed Metadata
You can define metadata fields such as Duration, Early Start (ES), and Early Finish (EF) inside the object braces {}. This embeds critical scheduling data directly into the visual node.
3. Set Directional Flow
Always include left to right direction at the top of your file. This forces a logical left-to-right progression, preventing unreadable vertical cascades.
4. Establish Connections
Use --> to establish sequential dependencies. Labels on arrows can clarify the nature of the dependency.
Example: PERT Chart Code
Below is a complete, ready-to-use PlantUML snippet for a project workflow. Copy this into your PlantUML editor to visualize the logic.
@startuml
left to right direction

' Define Tasks with Metadata
object "Project Kickoff" as kickoff {
  Duration: 2d
  ES: 0
  EF: 2
}

object "Requirements Analysis" as reqs {
  Duration: 5d
  ES: 2
  EF: 7
}

object "Design Phase" as design {
  Duration: 3d
  ES: 7
  EF: 10
}

object "Development" as dev {
  Duration: 10d
  ES: 10
  EF: 20
}

object "Testing" as test {
  Duration: 4d
  ES: 20
  EF: 24
}

' Define Dependencies
kickoff --> reqs
reqs --> design
design --> dev
dev --> test

' Add a label to a specific connection
reqs --> design : "Approval Required"

title "Project PERT Chart: Logical Sequence"
@enduml
3. From Logic to Timeline: The Gantt Chart
Once the logical dependencies are established via the PERT chart, you can visualize the execution timeline using PlantUML’s Gantt capabilities. While the syntax differs slightly to accommodate the calendar grid, the underlying data often remains consistent.
When constructing a Gantt chart, you focus on the Start and End dates or the duration of the tasks relative to the project start date. This visualization helps teams understand when resources are needed and identifies potential bottlenecks in the schedule.
Conclusion
By mastering these techniques, you elevate your project documentation from static artifacts to dynamic, living assets. Whether you are planning complex initiatives with uncertain durations using PERT charts or executing day-to-day tasks with strict deadlines using Gantt charts, the “Diagrams-as-Code” approach ensures your documentation is always up to date, version-controlled, and integrated into your team’s workflow.
 vpadmin
- November 3, 2026
