


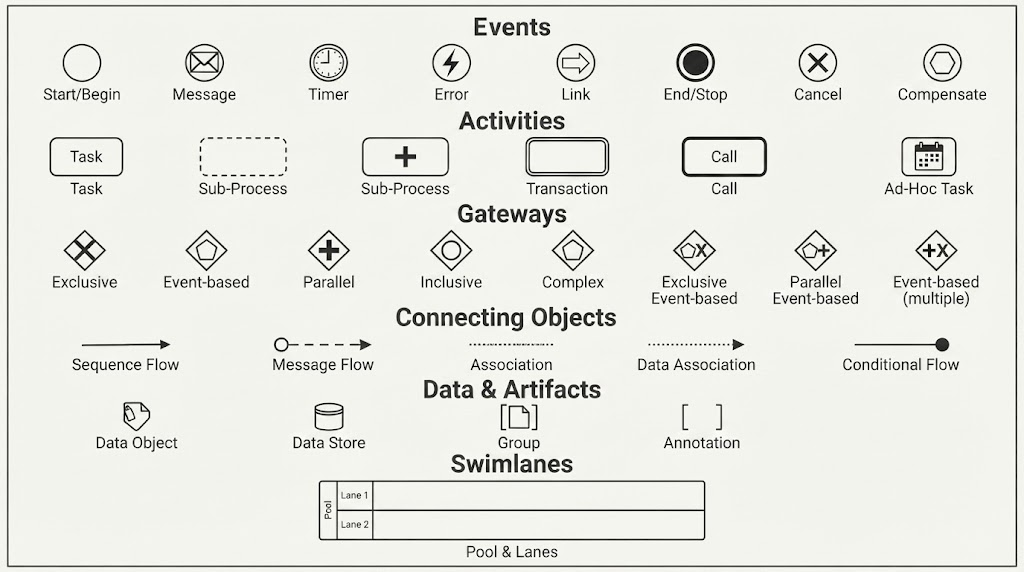
Welcome to your comprehensive guide on Business Process Model and Notation (BPMN). Whether you are a business analyst, a software architect, or a project manager, understanding how to visually map out complex workflows is an essential skill. This tutorial breaks down the universal language of BPMN, explaining how to structure diagrams, choose the right symbols, and ensure your models are clear, logical, and technically sound.
The Foundation: The Four Core Building Blocks
Before drawing a single symbol, it is crucial to understand the structural hierarchy of a BPMN diagram. Every valid diagram consists of four fundamental elements that work together to tell a story:
- Flow Objects: These are the active elements of the process. They include Events (things that happen), Activities (work that gets done), and Gateways (decision points).
- Connecting Objects: These lines define the relationships between flow objects, showing the order of execution (Sequence Flow) or communication between systems (Message Flow).
- Swimlanes (Pools and Lanes): These containers organize responsibilities. A Pool represents a major entity (like an organization), while Lanes divide the pool by role, department, or system.
- Artifacts: These provide additional context without affecting the actual flow. Examples include Data Objects, Groups, and Annotations.
Decoding Essential BPMN Symbols
Visualizing a process requires precision. Using the wrong symbol can change the meaning of the entire workflow. Let’s explore the specific symbols you must know.
1. Events (The Circles)
Events are represented by circles. They signify something that happens during the process. The style of the circle’s border and the icon inside dictate the type of event:
- Start Event (Thin Border): Marks the beginning of the process. It is the trigger that initiates the flow.
- End Event (Double Border): Marks the successful completion or termination of the process.
- Intermediate Event (Dashed Border): Represents something that happens during the process, such as waiting for a message or a timer.
Events often have specific “types” indicated by icons inside the circle:
- Message: Communication sent or received.
- Timer: A time-based trigger (e.g., “Wait 3 days”).
- Error: Exception handling.
- Signal: Broadcast notification.
2. Activities (The Rounded Rectangles)
Activities represent the actual work being performed. They are depicted as rounded rectangles:
- Task (Single Border): The smallest atomic unit of work. It is a single step that cannot be broken down further in the current context.
- Sub-Process (Dashed Border): A grouping of tasks. This allows you to collapse complex details into a single block for high-level views.
- Call Activity (Bold Border): A reference to a reusable process or global task. It calls another diagram to execute.
Task Markers: You can add small markers to a task to indicate specific behaviors:
- Loop Marker: The task repeats.
- List Marker: The task is a multi-instance task.
- Gear Marker: A Service Task, meaning it is automated.
3. Gateways (The Diamonds)
Gateways control the divergence and convergence of the flow. They are diamonds that determine which path the process takes:
- Exclusive Gateway (Empty Diamond / XOR): Represents a decision where only one path is taken (e.g., “If yes, go left; if no, go right”).
- Parallel Gateway (Plus Sign / AND): Represents a split where all paths are taken simultaneously (e.g., “Start shipping and send email at the same time”).
- Inclusive Gateway (Circle / OR): Represents a choice where one or more paths can be taken based on conditions.
- Event-Based Gateway (X Mark): The process waits for the first of several possible events to occur.
4. Connecting Objects
How do you link these shapes? The type of line you use matters:
- Sequence Flow (Solid Arrow): Shows the order of execution. It flows from one step to the next within the same process.
- Message Flow (Dashed Arrow): Shows communication between different entities (e.g., between two Pools).
- Association (Dotted Line): Links artifacts (like notes or data objects) to flow objects.
Best Practices for Modeling
When using tools like Visual Paradigm BPMN to construct your diagrams, remember that clarity is king. Always ensure that your Start Event has an outgoing flow, your End Event has an incoming flow, and that your Gateways are balanced (every split has a corresponding merge).
Conclusion
Mastery of BPMN comes from understanding the “why” behind every symbol. By combining the right Flow Objects, Connecting Objects, and Swimlanes, you can create powerful models that bridge the gap between business requirements and technical implementation. Start practicing with these core concepts, and soon you will be designing complex enterprise architectures with confidence.
 vpadmin
- November 5, 2026
